Japan Omics Browser (JOB) is an integrated search and visualization platform for multi-omics data, specialized for East Asian populations.
This help page provides an easy-to-understand guide on the basic usage of JOB and the functions of its interface.
Step 1: Access the Homepage
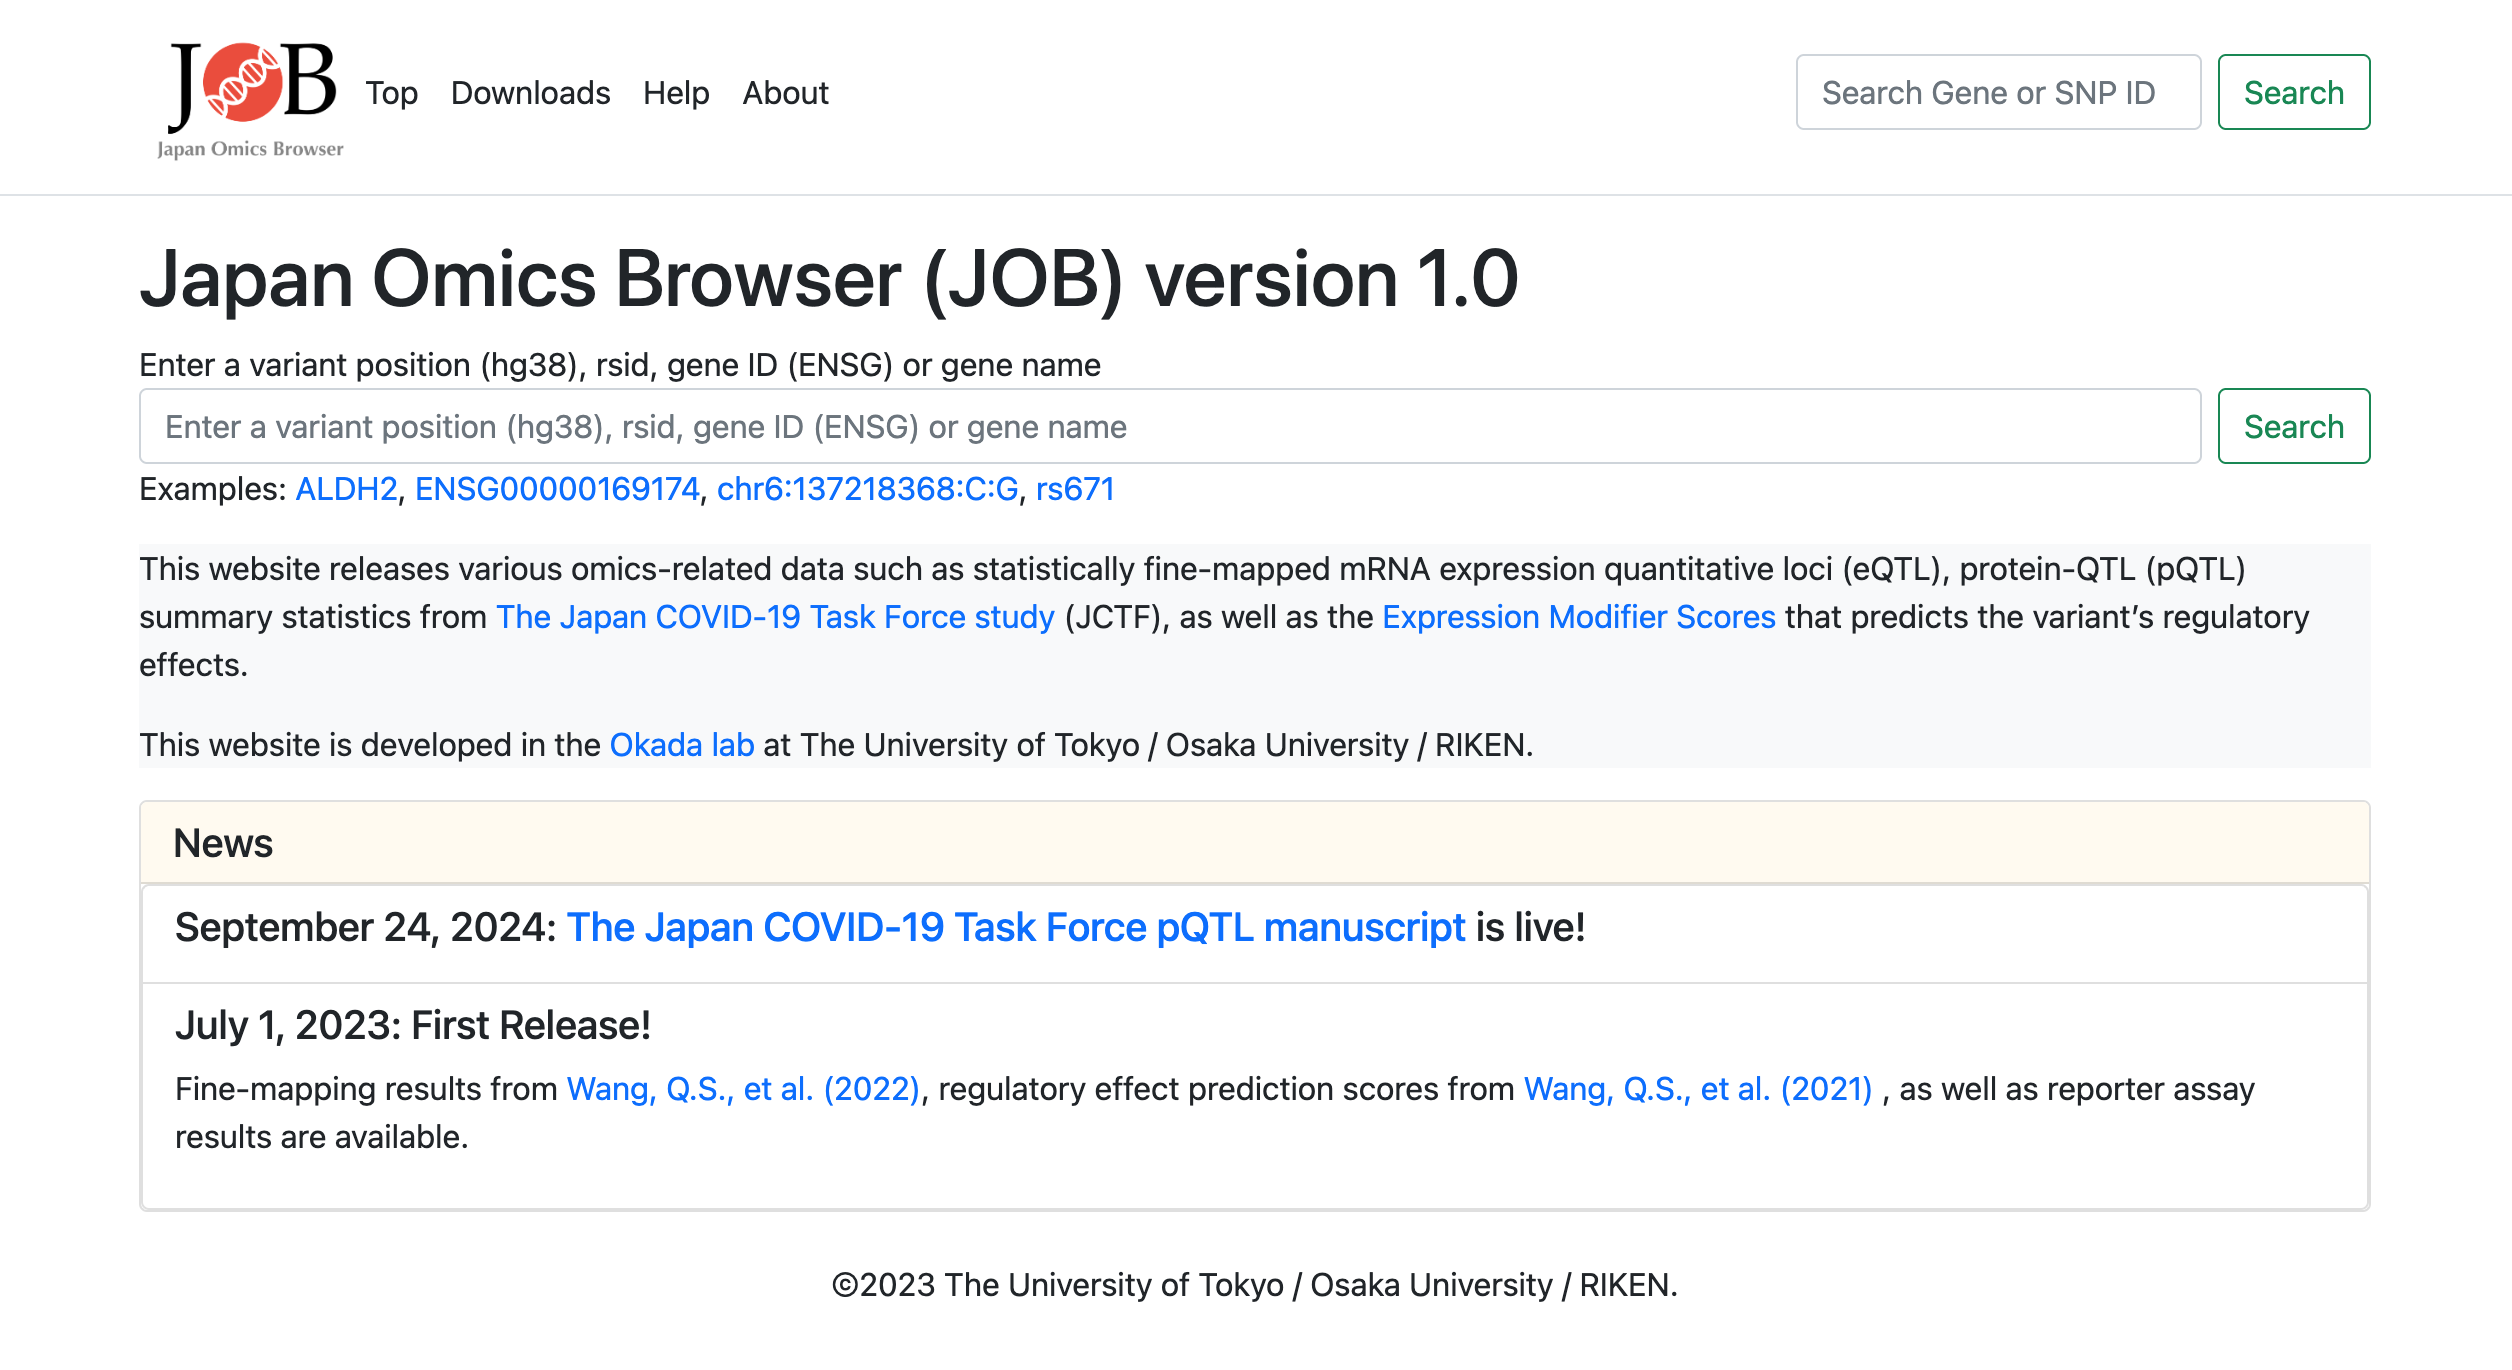
When you visit the official JOB website (https://japan-omics.jp/), a large search bar is displayed in the center of the homepage.
Below the search bar, you will see a prompt stating “Enter a variant position (hg38), rsID, gene ID (ENSG) or gene name” along with examples (ALDH2, ENSG00000169174, chr6:137218368:C:G, rs671).
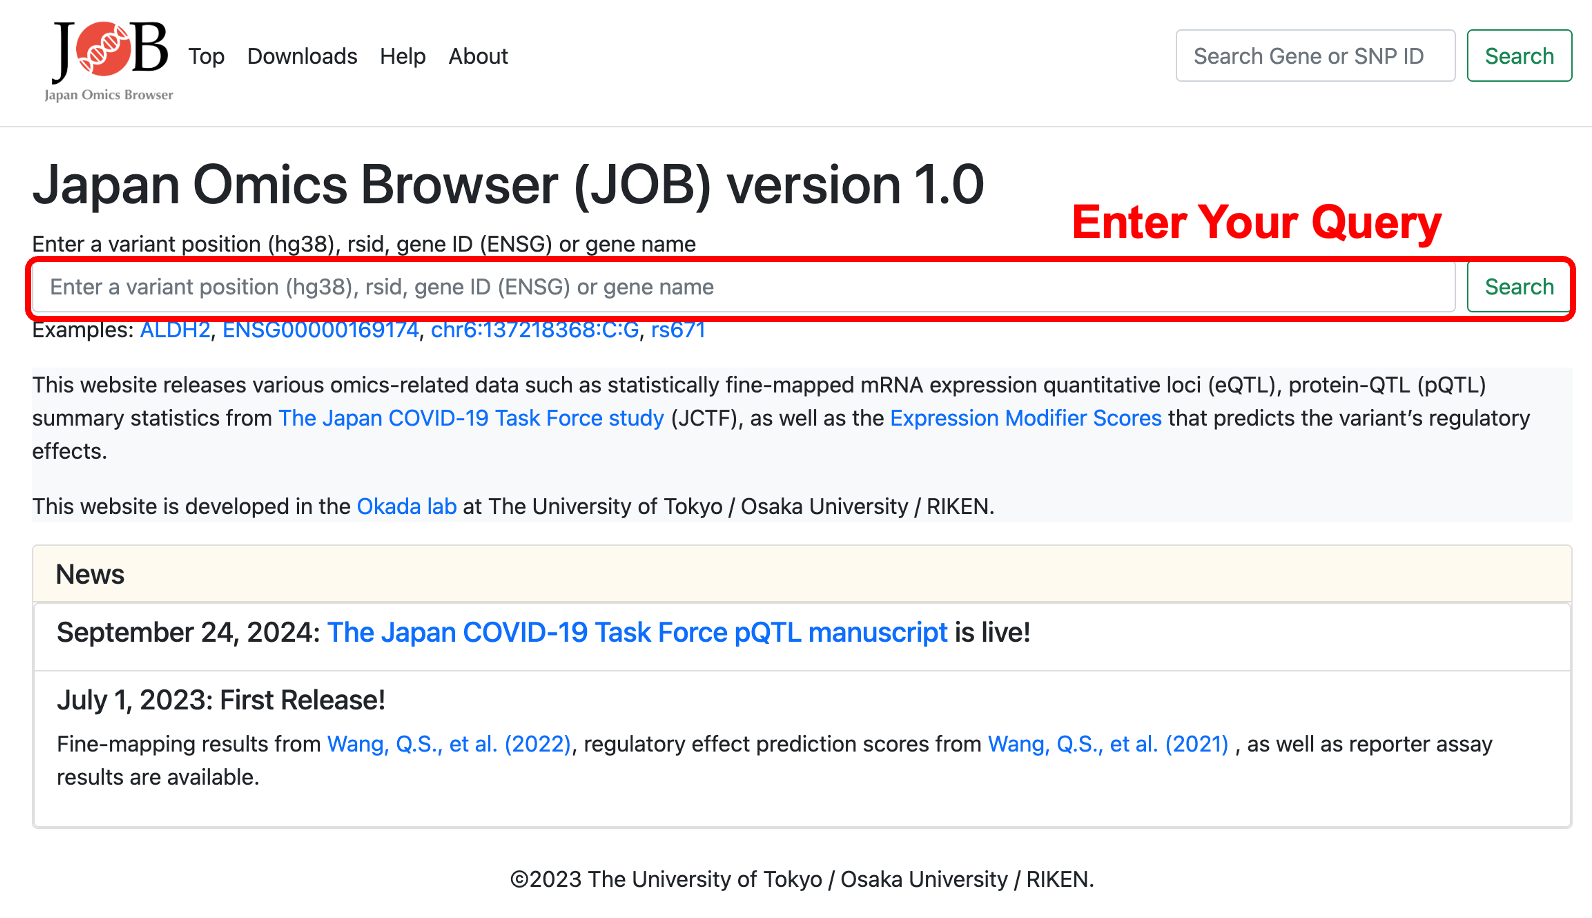
Step 2: Enter Your Query
Enter a Query: Click on the search bar (on the homepage or at the top of any page) and type a keyword. You can search by a variant or a gene.
Accepted inputs include:
・Variant ID (chr:pos:ref:alt in hg38): (e.g. chr6:137218368:C:G)
・rs ID (dbSNP): (e.g. rs671)
・Gene ID (Ensembl): (e.g. ENSG00000169174)
・Gene symbol (HUGO): (e.g. ALDH2)
Step 3: View the Search Results
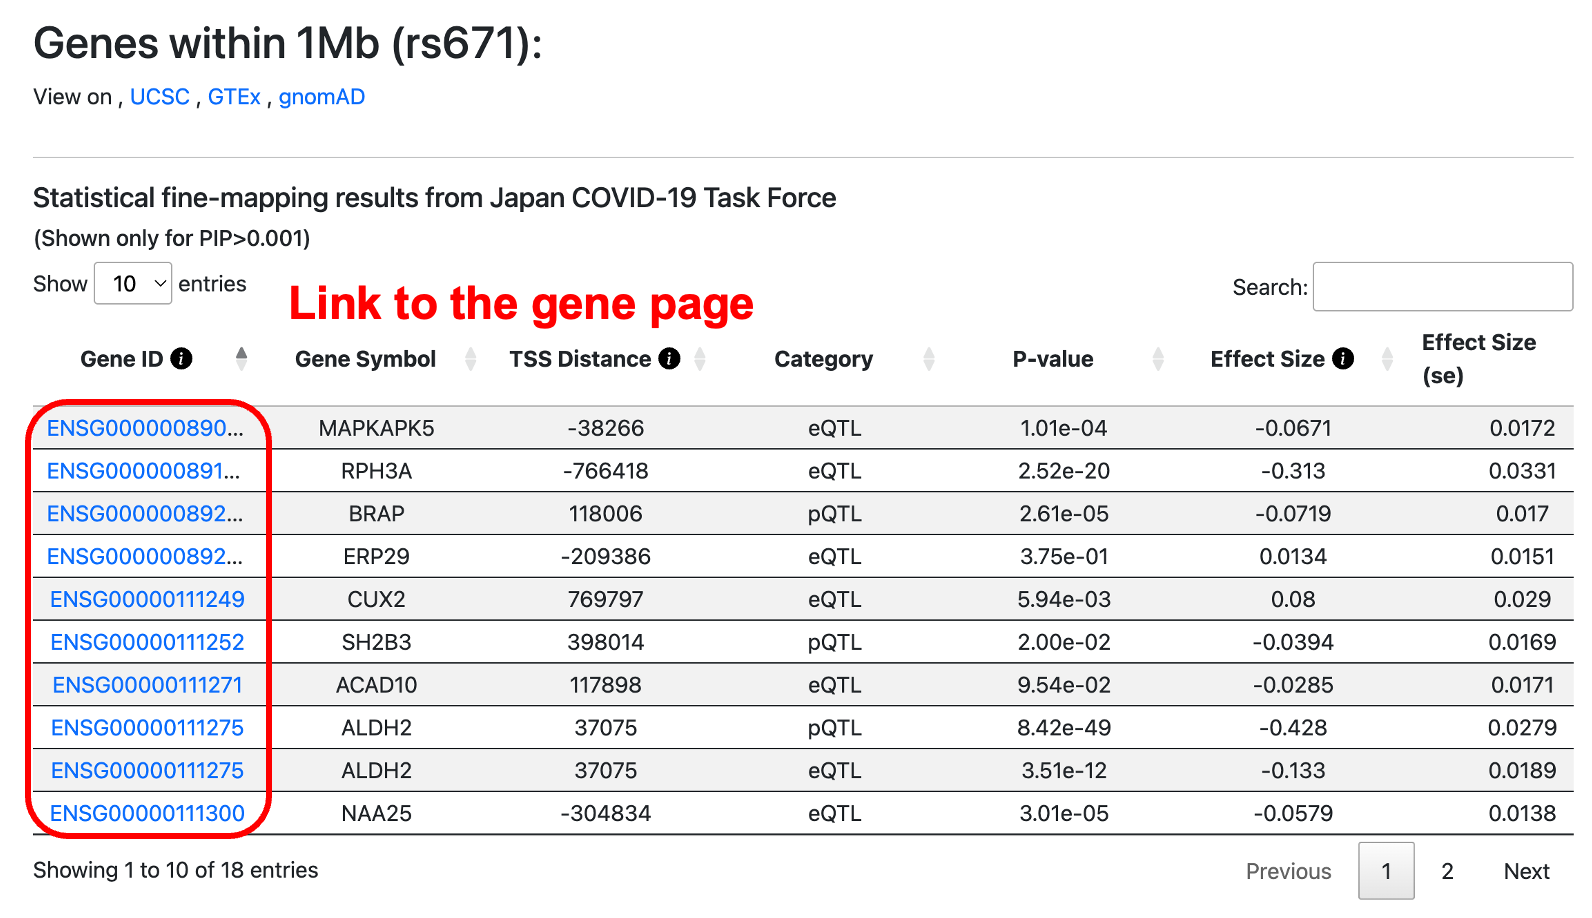
The search results are displayed on a dedicated results page based on your query.
For variant queries: Genes within a ±1Mb window around the queried variant and their statistical information are shown.
For gene queries: A list of variant information (such as eQTLs and pQTLs) associated with the gene is displayed.
Step 4: Use Additional Features
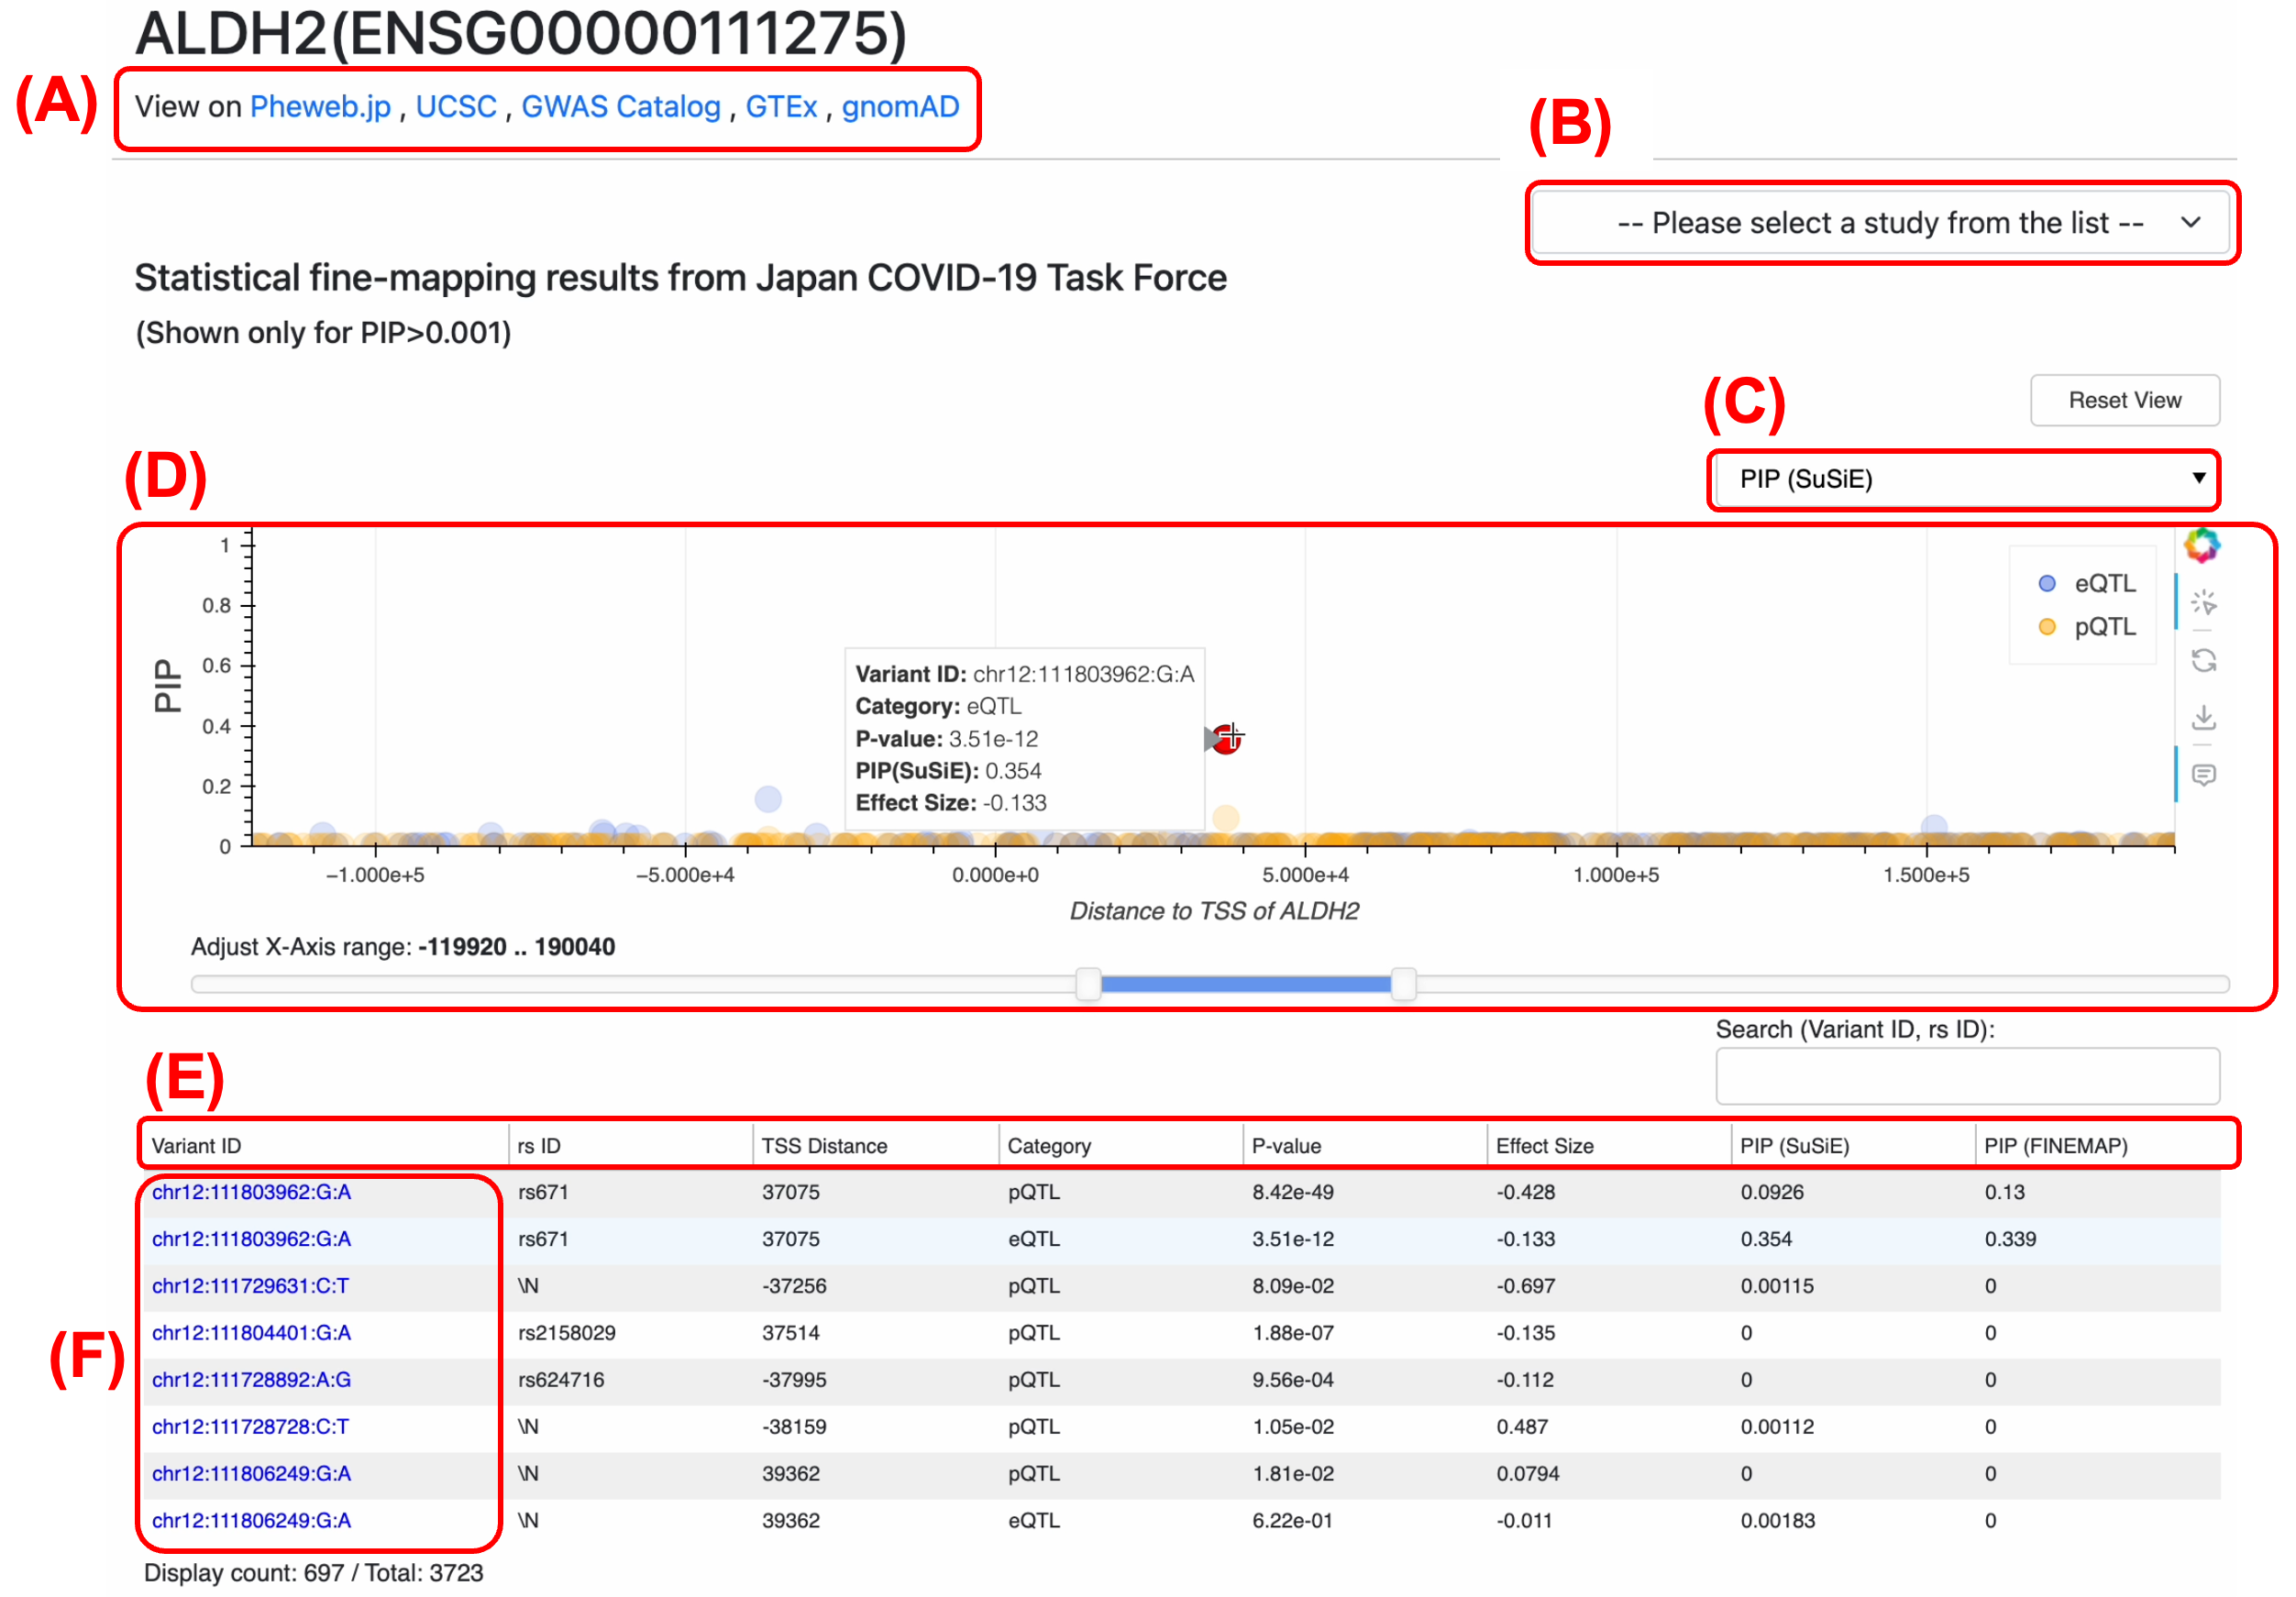
(A) External Resources Links: JOB integrates with external databases to provide more context for genes and variants. These links allow you to validate and further investigate findings from JOB using well-known genomic resources.
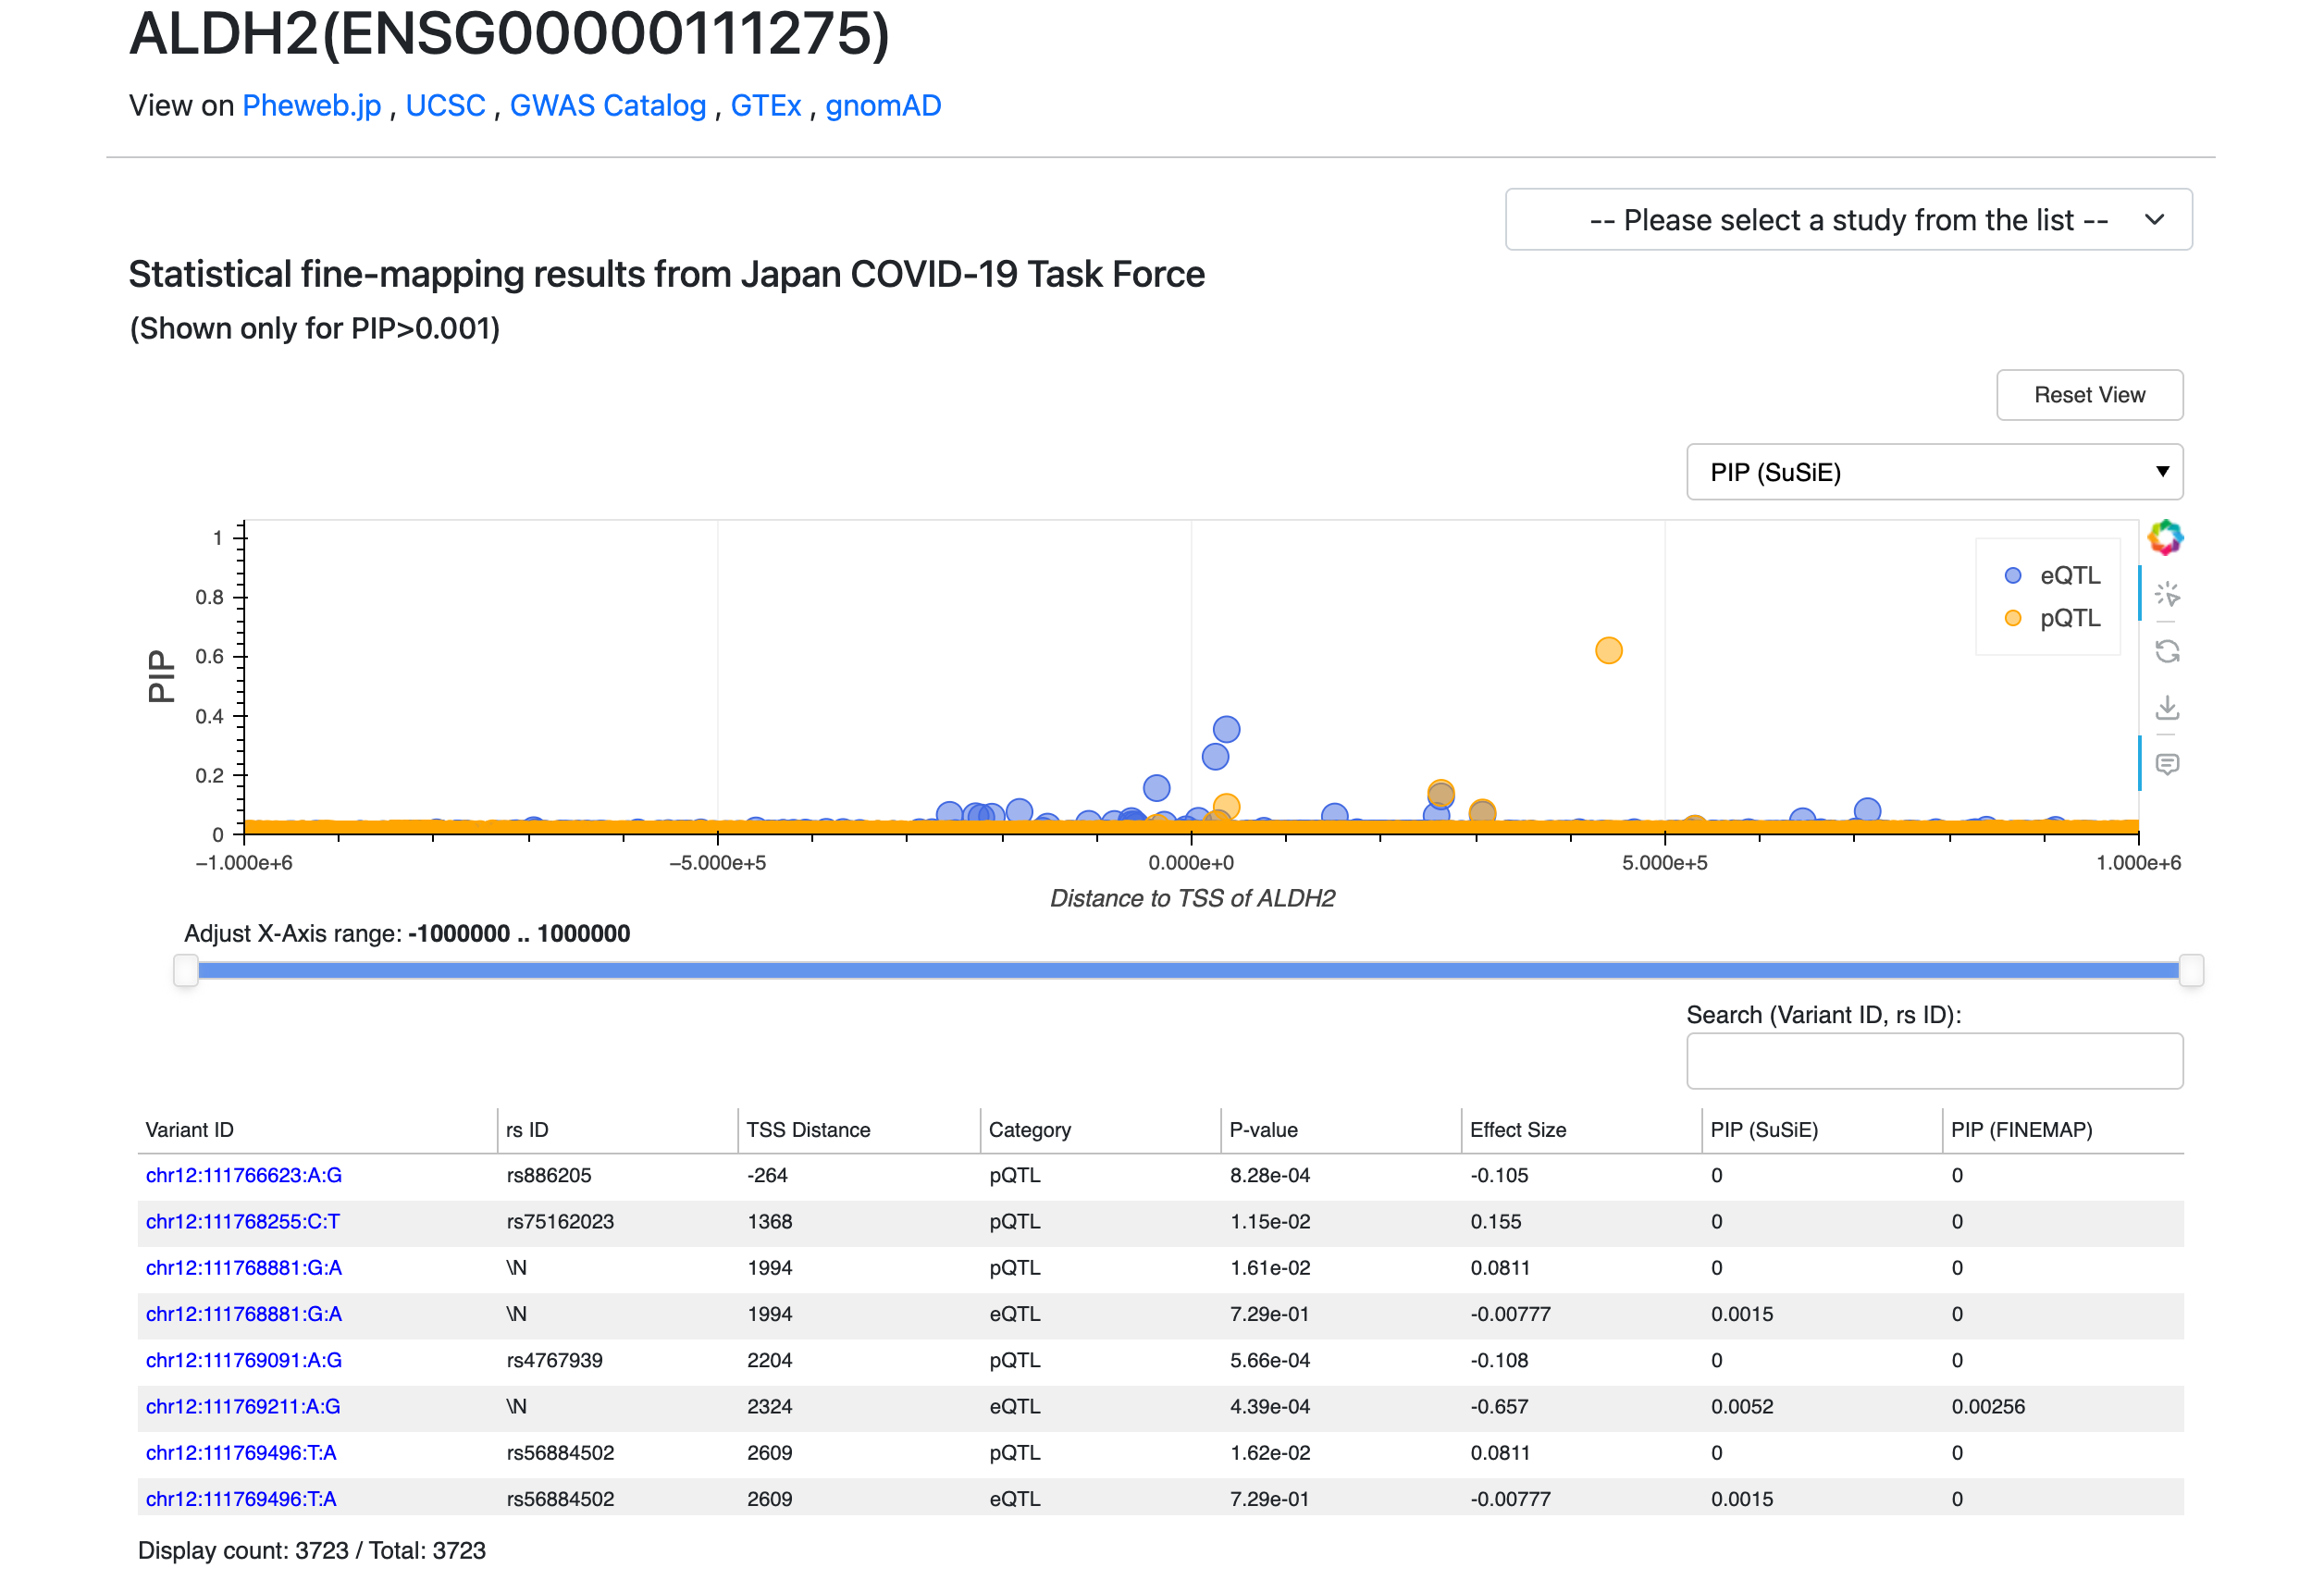
(B) Dataset Selection: Each interactive plot features a dropdown menu in the top-right corner that allows you to change the displayed research dataset. You can switch between various data layers—such as the Japan COVID-19 Taskforce fine-mapping data, the machine learning-based Expression Modifier Scores (EMS), and the UK Biobank trait fine-mapping results—to tailor the view to the specific omics information most relevant to your analysis.
(C) Customizing Plot Display: Each plot section has a dropdown menu (at the top-right corner of the plot area) that let you customize what is being displayed.
(D) Interactive Plots (Zoom & Tooltip): On a gene page, each plot is interactive. You can hover your mouse over any data point (variant) on the plots to see a tooltip with details for that variant. If the plots have many overlapping points, use the horizontal slider beneath the plots to zoom into a specific genomic region.
(E) Sorting and Filtering Data: Both gene and variant pages include data tables that you can sort. Click on any column header in a table to sort by that column’s values.
(F) Navigating Between Gene page and Variant page: JOB makes it easy to hop between the gene-centric and variant-centric views. If you are on a variant page and see a gene of interest in the table, click that gene’s link (the Ensembl Gene ID) – this will take you directly to the gene page for that gene. Conversely, if you are on a gene page and identify a variant of interest in the plot or table, click on that variant ID in the table and you’ll jump to the variant page for that variant.